1. Build a baseline that reflects your visitors
Network conditions can differ between customers on mobile data, shared Wi-Fi and fixed broadband. Device capability, coverage, congestion, server response and page design all affect the experience. Do not assume that every slow visit in Kashmir has the same cause.
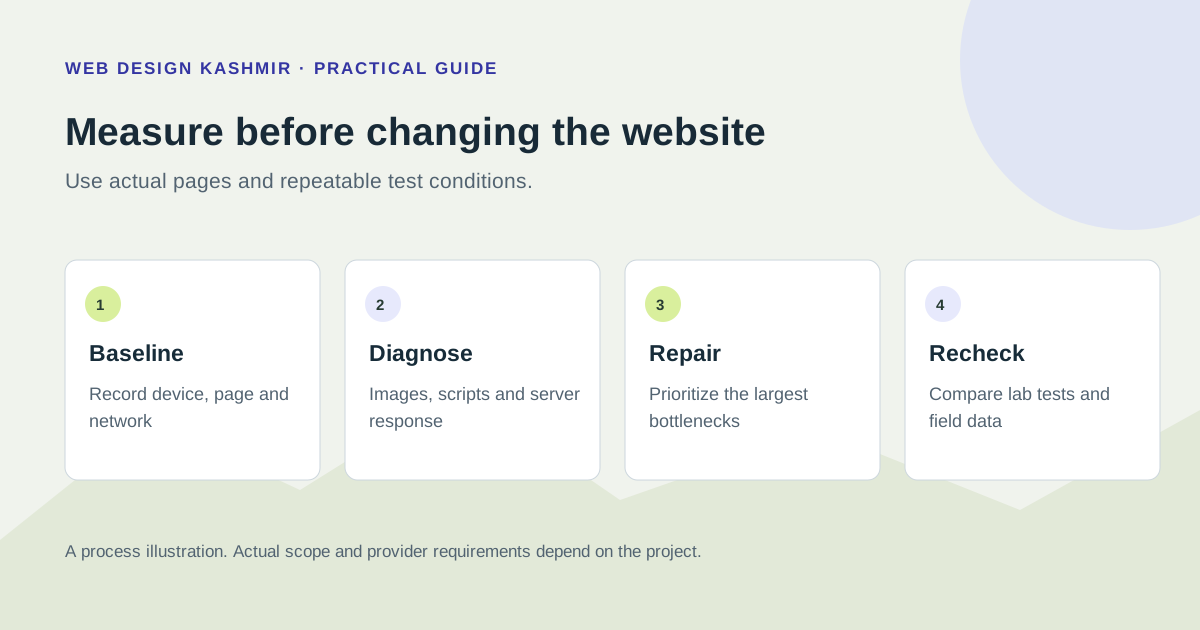
Choose a small set of important pages: homepage, service or product detail, contact form and checkout or booking. Record the tested URL, date, device, browser, network conditions and whether the browser cache was warm or cold. Save the report before making changes so later comparisons use the same conditions.
Use a lab test to investigate the page and field data, where available, to understand real visits. A small site may not have enough public field data; that absence is not proof of poor performance. Ask customers what task failed or felt slow and reproduce the task.
2. Measure the task as well as the page
A visually quick homepage is only one part of the journey. A visitor may wait for a product filter, a date picker or a form submission. Check loading, interaction and layout stability. Also record functional problems such as an unclickable submit button or a calendar that loses the selected date.
Google’s Core Web Vitals overview describes good thresholds of LCP at or below 2.5 seconds, INP at or below 200 milliseconds and CLS at or below 0.1, assessed at the 75th percentile of visits. These are distinct metrics; a Lighthouse score of 100 is not a “100/100 Core Web Vitals” measurement.
Do not attach a guaranteed sales percentage to a speed change without a valid measurement method. Compare enquiry and checkout completion alongside performance, and note other changes such as campaigns, pricing or seasonal demand.
3. Diagnose the waterfall instead of blaming a platform
Browser developer tools show when requests start, how large they are and what blocks rendering. Start with the main document and the image or text that becomes the largest visible element. Then look for large transfers, slow third-party requests and JavaScript that keeps the main thread busy.
| Observation | Likely investigation | Potential action |
|---|---|---|
| Slow initial document | Hosting response, database work and cache behaviour | Profile expensive queries and check server caching. |
| Large hero image arrives late | File dimensions, compression, discovery and priority | Serve an appropriately sized image and make it discoverable early. |
| Buttons lag after content appears | Long JavaScript tasks and third-party code | Reduce unnecessary work and defer nonessential features. |
| Content jumps while loading | Missing image dimensions or reserved widget space | Set dimensions and reserve space for late content. |
| Repeat visits remain heavy | Cache headers and asset versioning | Cache static assets while preserving safe updates. |
These are diagnostic possibilities, not proof that a particular theme or provider is responsible. Confirm the cause in the actual trace. If several scripts are involved, disable them one at a time in a staging environment and retest the same interaction.
4. Improve the largest bottlenecks first
- Size images for their display. Keep originals outside the page delivery path, provide responsive variants and inspect visual quality after compression. Avoid loading a full-resolution photograph into a small card.
- Prioritise the first useful view. Keep the main heading, key image and contact action available without waiting for an animation. Do not lazy-load the critical first image simply because lower images are lazy-loaded.
- Review scripts and embeds. Remove unused widgets and load optional videos or maps when needed. Check whether analytics and advertising scripts introduce new delays.
- Reduce server work. Cache suitable public content and improve slow queries. Verify the response headers rather than assuming a cache plugin is active.
- Protect visual stability. Reserve image and embed space, use predictable font behaviour and avoid inserting banners over controls.
Set an initial performance budget based on the actual page and customer need. For example, an internal checklist can require each newly added hero image to be reviewed for dimensions and transfer size. That is a project rule, not a universal Google requirement. Retest with the complete content and integrations.
5. Configure caching without exposing private content
A content delivery network can cache suitable assets closer to users, but routing and timing depend on the provider and the visitor. Do not promise a fixed latency or a specific data centre for every request. Measure the actual response and document what is cached.
Keep account pages, carts, authenticated dashboards and customer-specific responses out of shared public caches. A cache that serves one visitor’s private information to another is a serious defect, even if the page becomes faster. Payment callbacks and booking inventory also need deliberate cache rules.
Test a guest, a signed-in user and two different shopping carts after changing rules. Confirm that stock, prices and booking availability remain current. Use the provider’s current documentation and a rollback plan rather than copying a generic “cache everything” setting.
- Record the baseline
- Make one agreed change
- Check and keep rollback
Choose a repair from the part of the journey that is slow
| Observed problem | Inspect next |
|---|---|
| Long wait before content appears | Server response, redirect chain and the main content or image request. |
| Page appears but controls react late | Long browser tasks, large scripts and the interaction that triggers the delay. |
| Text or buttons move during loading | Missing media dimensions, font changes and content inserted above existing elements. |
| Submit button responds but no request arrives | The form endpoint, validation, delivery result and error handling. |
This table narrows the investigation; it does not diagnose a page without a trace or reproducible test. Keep one change and its functional result in the release record before combining further optimisations.
What changed on this website: a documented homepage lab example
Owned-site evidence · saved sessions from 18 and 19 October 2026
The homepage of this website provides a real example to inspect. Saved PageSpeed reports recorded the following mobile results before and after a release that self-hosted fonts, consolidated styles and added smaller responsive images.
| Measure | Earlier mobile session | Final mobile session |
|---|---|---|
| Lighthouse performance | 87 / 100 | 99 / 100 |
| Lab Largest Contentful Paint | 2.9 seconds | 1.8 seconds |
| Report dates | 18 October 2026 | 19 October 2026 |
| Real-user field coverage | No CrUX data reported | No CrUX data reported |
The reports used Lighthouse 13.5.0, an emulated Moto G Power and Slow 4G for the recorded mobile sessions. Several changes shipped together, so the comparison does not isolate the contribution of one image or stylesheet. A first post-release session scored 98; the final session scored 99. That small variation is not evidence that a later discovery-file edit made the page faster.
Inspect the earlier mobile report and final mobile report; public report retention can change. These observations concern the homepage in those sessions. They do not measure field INP, every page, rankings or sales. Google’s PageSpeed documentation explains the difference between lab and field data.
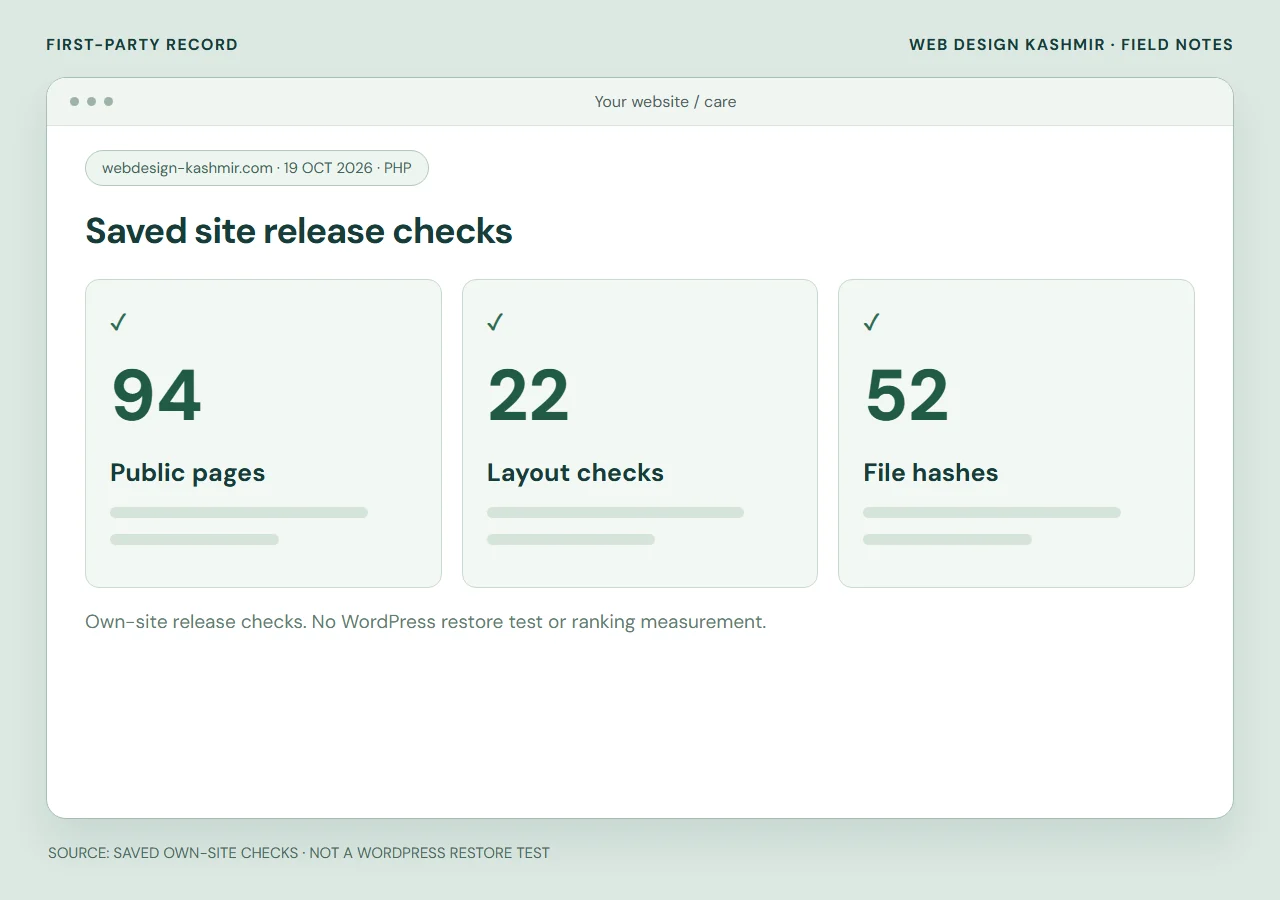
For your own release, save the reports, changed files, device settings and functional checks together. Re-run the same page and keep failed enquiries or broken navigation visible in the acceptance record rather than reporting only a higher score.
6. An illustrative clinic audit workflow
This is a worked process example, not a client case study or a claimed result. Suppose a clinic has a homepage gallery, an embedded map, an appointment form and a chat widget. Start by timing the appointment journey on a phone: open the site, find the service, choose an appointment request and submit.
Review the first screen’s photographs, then the map and chat requests. A possible experiment is to compress the gallery and replace the immediately loaded map with a labelled link or click-to-load map. Keep the address readable and test that visitors can still obtain directions.
For each experiment, write down the change, the reason, the before/after test conditions and any functional risk. If the form stops delivering messages, revert or fix that defect before calling the experiment successful. Only publish real results once they can be supported by saved reports and client permission.
7. A repeatable audit and release checklist
- Save mobile and desktop reports for representative URLs before editing.
- Use staging and a recoverable backup before changing themes, caching or database queries.
- Check the network waterfall and the largest visible element.
- Test keyboard navigation, readable text and controls while assessing responsiveness.
- Submit forms and complete a test payment or booking flow in the appropriate test environment.
- Compare the same conditions after the change; note normal test variation.
- Monitor errors and real enquiries after launch, then review field data as it accumulates.
Keep a small change log with the date, affected pages, test evidence and rollback location. Avoid repeated rebuilds when an image or a single third-party widget is the main issue. For platform choices, see WordPress versus custom PHP. For wider search changes, use the SEO measurement guide.
A useful deliverable from a performance audit is a ranked list: impact on the customer, evidence, proposed fix, effort and verification method. It is more actionable than a screenshot with a score and no explanation.